One loop that turns a process idea into simulated, costed and ranked options, keeps the running reactor under watch, and learns from every lab, pilot and plant run.
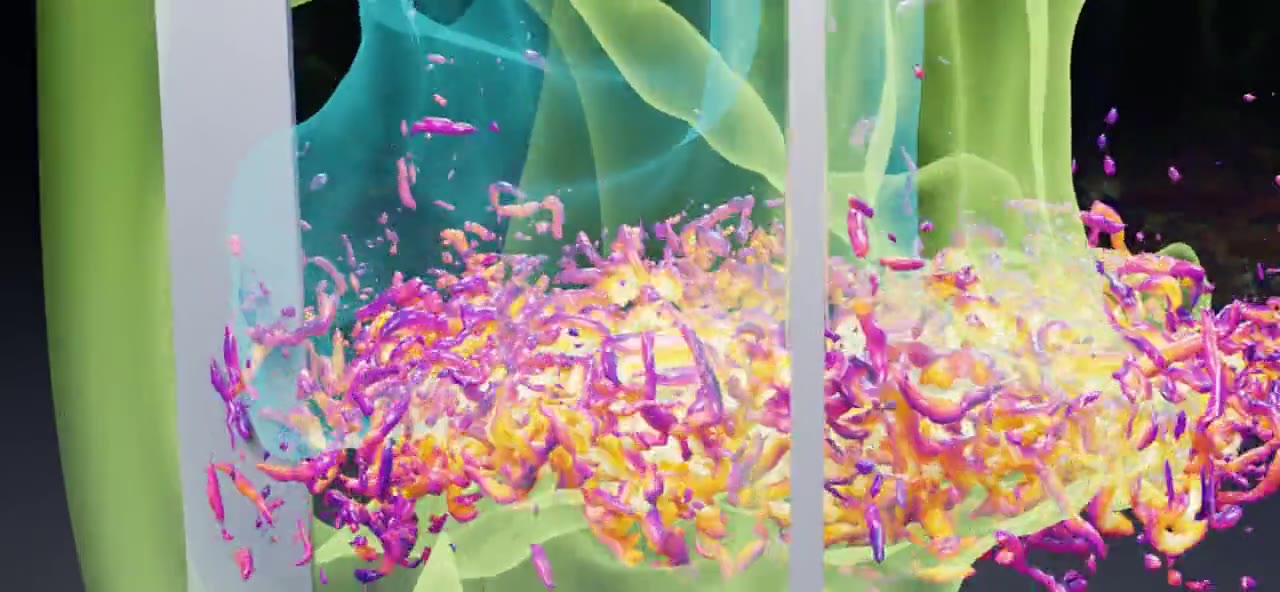
Vortex cores around a Rushton impeller and a dosed tracer spreading through a baffled tank, computed by our GPU-native lattice Boltzmann solver.
Watch the solver at work
A stirred tank where bacteria turn glucose into hydrogen and CO₂.
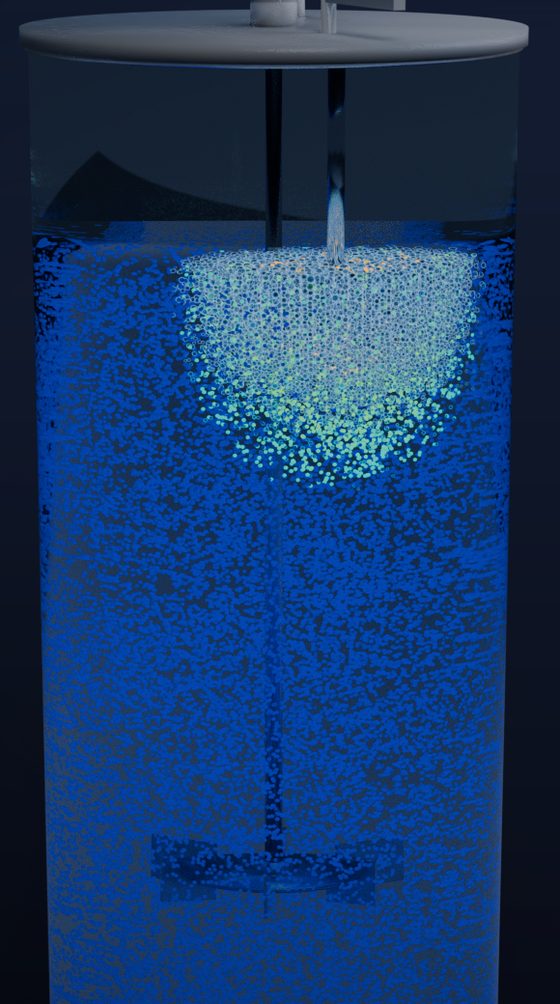
The liquid driven by the turbine, 200,000 bacteria followed one by one (colour shows how much glucose each one finds), and gas bubbles rising to the surface. The side charts show what goes in and what comes out.
What it shows about the software
Flow, bacteria, chemistry and gas computed together in one code
The history of every bacterium, the quantity that matters in scale-up
Closed mass balance for every species
80 min
On a single workstation GPU
The whole coupled run, from the first impeller turn to the last bubble.
1+ days
The same case in OpenFOAM, our estimate
On a 32-core computer, and only after programming the coupling of bubbles, chemistry and individual bacteria, which it does not provide ready to use.
A demonstration, not the prediction of a real fermenter: the biology runs about 450 times faster to fit the film, the kinetics are generic, and validation of the flow is still in progress.
01 · Who we are
Bioprocess engineering and HPC, in one team.
CEO · Bioprocesses and AI
Simone Perazzoli, PhD
Environmental engineer with a PhD in Chemical Engineering from the Federal University of Santa Catarina, Brazil, on biotechnological processes: biomethane from microalgae, nitrifying bacteria and microbial electrochemical cells for water treatment. More than 300 citations. Now a machine learning engineer building platforms for process automation, and completing a second degree in Artificial Intelligence.
Brings what the microbes need, what the data says, and how AI should reason about both.
HPC and GPU-native simulation
José Pedro de Santana Neto
Software engineer (University of Brasília) with an MSc in Mechanical Engineering on lattice Boltzmann methods (Federal University of Santa Catarina), completing a PhD in Computer Science specialized in HPC at the Federal University of Paraná. Built high-performance lattice Boltzmann software at NUMECA International in Belgium, now part of Cadence, and was a research associate in HPC simulation at the University of Geneva.
Brings the physics inside the vessel, written from the compiler up and resident on the GPU.
Together with you
Your lab and plant bring organisms, data and know-how.
The AI layer runs the study end to end.
The Constela solver resolves the physics inside the vessel.
GPU-nativeOne resident run, no hand-offsFlow, cells, species and bubbles advance together on the GPU.
Cell-level biologyEvery microbe has a historyKinetics respond to what each cell meets on its path.
Deterministic, traceableAgents orchestrate, engines computeEvery number comes from a solver run you can trace.
Open and yoursNo per-seat licenseOpen core (MIT), commercial extension, cloud or on-premises.
02 · What we want
Move the expensive surprise to the start of the project.
In a flask every cell sees the same conditions. In a production tank, cells travel through zones of excess substrate, starvation and dissolved gas, again and again. Those gradients change yield, and they usually show up at pilot or plant scale, years into the work.
Early cost estimates carry wide ranges for the same reason: the process data that would narrow them does not exist yet. We want that data to exist on day one, as a simulation you can question.
What one cell sees on one circulation loop
Near the feedexcess substrate, by-products, dissolved gas builds up
In the bulklimitation, the regime the process was designed for
Far from itstarvation, cells slow down
What success looks like
Success is moving the expensive surprises of bioprocess scale-up from the plant to the model, where they are cheap.
03 · What we offer
See what every cell sees.
Each simulated microbe is a particle carried by the resolved flow. It records the substrate, dissolved gas and shear on its path, grows and produces from what it meets, and returns gas to the liquid as bubbles that rise and exchange with it.
designCompare impellers, baffles, spargers, feedsscale-upPower, mixing time, kLa, gas hold-upcellsExposure history of every cellbenchScale-down experimentsgasDissolved, bubbles, exhaust gaseconomicsNumbers ready for capex and opex
Illustration from our coupled solver: each dot is a cell coloured by the substrate it sees (amber excess, green limitation, blue starvation); rings are gas bubbles.
Illustration from our coupled solver: the same vessel at full height.
What a first study delivers
01
A flow map of your vessel
Mixing time, power draw and dead zones, checked against your own measurements.
02
What your cells see
The substrate, gas and shear each cell meets, ready for your kinetic model.
03
Gas, from the liquid to the outlet
Dissolved gases, bubbles and the composition of the gas leaving the vessel.
04
Ranked options
Design and operating choices ranked, with the numbers your economics needs.
Results are delivered as numbers a process model can take in (kLa, power per volume, mixing time, gas hold-up), so they feed heat and mass balances and techno-economic analysis without rework.
Each deliverable comes with an acceptance criterion agreed before the runs.
04 · How we help
One platform, one loop.
AI agents read the requirements and drive the work. Fast learned models sweep the design space, high-fidelity solvers confirm the best candidates, techno-economic analysis ranks them, and sensors on real bioreactors feed the results back, so each cycle starts from better models.
Specify→Explore→Verify→Cost→Run→Learn↺
requirements and economicsmodels and computereal bioreactors and live dataTODAYrunning now; the other blocks are in development
04 · How we help · Operate
Keep the reactor running, and see trouble hours before it arrives.
The platform that designs the process also watches it run. Site reliability engineering, applied to bioreactors: live monitoring, automatic alerts, service levels agreed in advance, a prepared incident response, and a forecast of the reactor state hours ahead.
MONITOR · 24/7
Every vessel, live
pH, dissolved gases, exhaust gas, temperature, feed and level, checked against limits and against what the model expects.
ALERT · AUTOMATIC
The right person, at once
A deviation raises an alert the moment it appears, routed to whoever is on call, with context.
RESPOND · INCIDENT PLAN
Back to target state
A prepared runbook: contain, communicate, bring the reactor back to its target state, review the cause.
PREDICT · 1 TO 5 H AHEAD
Failures seen before they happen
Sensor data feeds models that forecast the reactor state and flag a drifting variable before its limit.
Schematic. The forecast crosses the alarm limit hours before the measurement would.